Import packages + MyPCA + MyKMeans and Iris dataset.
1
2
3
4
5
6
7
8
9
import os
import numpy as np
import matplotlib.pyplot as plt
%matplotlib inline
from tqdm.notebook import tqdm
from sklearn import datasets
import scipy.stats as spst
from sklearn.datasets import make_spd_matrix
from scipy.special import softmax
1
os.getcwd()
'/content/drive/My Drive/CS229/Notes7b-GMM'
1
%cd /content/drive/My Drive/CS229/Notes7b-GMM
/content/drive/My Drive/CS229/Notes7b-GMM
1
2
3
4
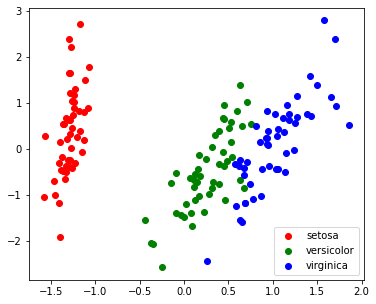
iris = datasets.load_iris()
iris.target_names
X = iris.data
y = iris.target
1
2
3
4
5
6
7
8
9
10
11
12
13
14
15
16
17
# PCA defmyPCA(X:np.ndarray, n_dimensions:int): # N, d = X.shape # Centering X_centered = X - X.mean(axis=0)
# Covariance Matrix of d*d Sigma = np.dot(X_centered.T, X_centered)
# Purposely rescale and add negative sign to mimic Sklearn's PCA return -(X_PC - X_PC.mean(axis=0))/X_PC.std(axis=0)
1
2
3
4
5
6
7
8
9
10
11
12
13
14
15
16
17
18
19
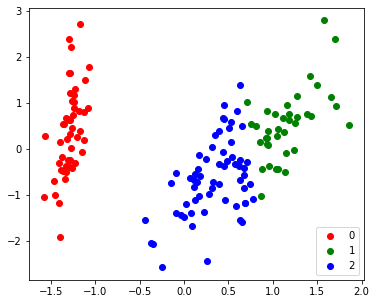
defmyKMeans (X: np.ndarray, k: int, iterations=100, tol=0.001): N, d = X.shape mu = X[np.random.choice(range(N), size=k)] c = np.zeros(N)
for step in tqdm(range(iterations)): prev_mu = mu.copy()
for i in range(N): c[i] = np.argmin(np.linalg.norm(X[i] - mu, axis=1)**2) for j in range(k): mu[j] = np.mean(X[np.arange(N)[c==j]], axis=0)
if (np.sum(np.linalg.norm(prev_mu - mu,axis=1)) < tol): break distortion = np.sum([np.sum(np.linalg.norm(X[np.arange(N)[c==i]] - mu[i], axis=1)**2) for i in range(k)]) print(f"distortion: {distortion}")
# w = post_z: (N, k) N, d = x.shape k = phi.shape[0] post_z = np.zeros((N,k))
for i in range(N): numerator = [spst.multivariate_normal.pdf(x[i], mean=mu[j], cov=Sigma[j]) * phi[j] for j in range(k)] sum = np.sum(numerator) post_z[i] = numerator / sum return post_z
N, d = x.shape _, k = w.shape phi = np.mean(w, axis=0) mu = np.dot(w.T, x) / np.expand_dims(np.sum(w, axis=0),axis=1) Sigma = np.zeros((k,d,d)) for j in range(k): Sigma[j] = np.sum([w[i][j] * np.outer((x[i]-mu[j]), (x[i]-mu[j]).T) for i in range(N)], axis=0) / np.sum(w[:, j]) return phi, mu, Sigma
1 2 3 4 5 6 7 8 9 10 11 12 13 14 15 16
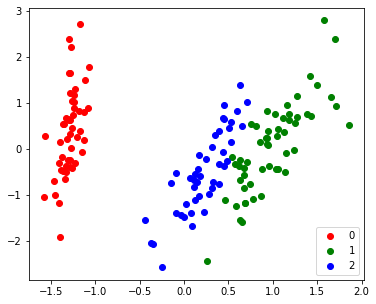
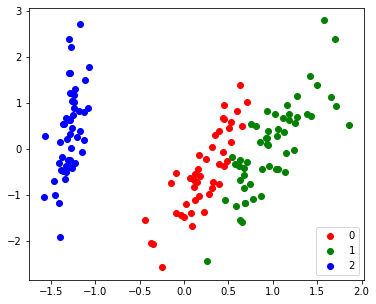
defmyGMM (X: np.ndarray, k: int, iterations=100, tol=0.00001): N, d = X.shape X_sample = X[[np.random.choice(range(N)) for i in range(k)]]
phi = softmax(np.random.random(size=k)) mu = X_sample Sigma = np.concatenate([make_spd_matrix(d) for i in range(k)], axis=0).reshape(k,d,d)
for step in tqdm(range(iterations)): prev_phi = phi w = E_step(X, phi, mu, Sigma) phi, mu, Sigma = M_step(X, w) if np.sum(np.square(phi-prev_phi)) < tol: break return w